


Double Top: What is a Double Top in the financial market?
Double Top is a common chart pattern in technical analysis of stocks that indicates resistance in price action.
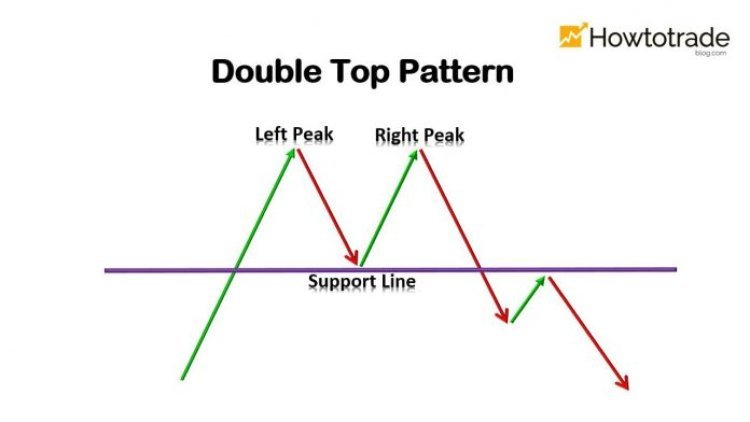
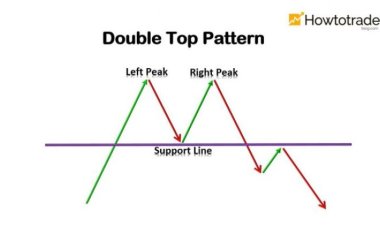
As the name suggests, a Double Top occurs when two consecutive highs on the chart are separated by a low point.
In chart analysis, this pattern always shows resistance, meaning that the stock price is struggling to surpass the price at which the Double Top was formed. In this article, you will understand the differences between a Double Top and a Double Bottom and what happens when there is a breakout of the top.
What is a Double Top in financial markets?
A Double Top is a chart pattern used in the technical analysis of stocks. It is represented by two peaks at the same height separated by a trough.
Unlike fundamental analysis, which examines a company's fundamentals and information about its financial health and cash generation, technical analysis only looks at the price behavior of the stock and its behavior on the chart over a certain period of time, which can be minutes, hours, days, or weeks.
When a Double Top forms, according to extensive literature on the subject, it is concluded that a price resistance has formed.
It is easy to understand why when observing price trends: a Double Top signals that the stock price has reached a certain value twice but failed to surpass it.
This creates resistance: the market is indicating that this is the highest price a stock can reach within a period of time.
Graphically, the Double Top resembles an uppercase "M," making it easy to identify in day-to-day analysis.
Once this pattern forms, a long downward trend may begin. Consequently, it is said to indicate a reversal of the trend from an uptrend to a downtrend.
But this is not a rule that applies to all Double Tops. Like other chart patterns, you should confirm this trend with additional data and indicators.
Interpretation of the breakout of the Double Top
Just as a Double Top formation can signal a reversal from an uptrend to a downtrend, a breakout of a Double Top can also provide useful information to traders.
In general, the breakout is associated with an uptrend. Note: The stock price hit a certain level twice but failed to surpass it. On the third attempt, it managed to break through. This is indicative of a Double Top breakout.
Consequently, the price is expected to continue on an upward trajectory because it broke the resistance.
However, one must be cautious of false breakouts that occur when the line is crossed but the price does not follow an upward trajectory.
This is why when using technical or fundamental analysis indicators, caution should be exercised before making an investment decision.
Double Top is just one factor
The Double Top is one of the most popular technical analysis patterns among investors, but it cannot be used alone to make investment decisions.
This rule actually applies to any technical indicator or fundamental analysis: every decision should be based on multiple elements. Those who decide whether it is time to buy or sell a stock based on just one indicator inevitably make mistakes in analysis.
This is because the Double Top indicates a reversal from an uptrend to a downtrend but does not guarantee such a reversal. To mature your investment decisions, the only way out is to gather as much information as possible.
Study technical and fundamental analysis in detail, discover their different aspects, experiment in practice with controlled risk, and accumulate knowledge over the years. This is the formula for success in the stock market, analysis, and long-term financial markets.
What's Your Reaction?
 Like
0
Like
0
 Dislike
0
Dislike
0
 Love
0
Love
0
 Funny
0
Funny
0
 Angry
0
Angry
0
 Sad
0
Sad
0
 Wow
0
Wow
0